Finn O'Brien
Last updated: 12 January 2026
In this article, you will find:
Navigation guidance for accessing the reporting area.
Key information about the reporting area of the OneClickComply platform.
An important aspect of compliance is understanding both how far you have come, but also how much more work there is left to be completed. The Reporting area allows you to gain a top-down view of your how many tasks you have remaining.
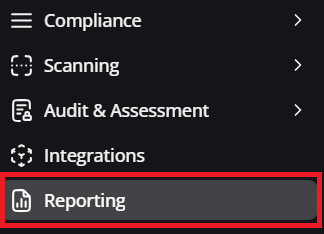
This area can be accessed by selecting the Reporting option from the navigation menu, as shown below:

Navigation guidance for accessing the reporting area
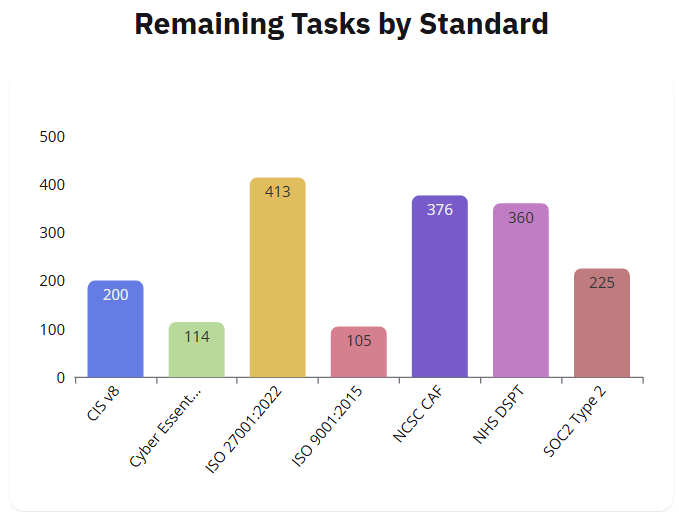
As mentioned above, the Reporting area allows you to quickly understand you current progress, and view outstanding work through accessible formats such as charts and tables. Here is an example of what you may find on this page.

Reporting area progress indicators

Outstanding task bar chart
Both of these areas help you understand your compliance progress in different fashion. The large boxes show your current technical compliance with a standard in a percentage form, whereas the bar graph indicates how many tasks you have remaining, broken down per standard.
These graphs can also be exported by hovering over the desired image and selecting the save icon at the top right, and provide an easy way to demonstrate your compliance journey to potential customers, partners, or investors.